Occasionally, if we cannot diagnose a problem remotely, we will ask customers to capture a logfile of data exchanged between Helm and a broadcast device. For IP-based equipment the best logging tool is WireShark. For RS232 and RS422 serial communication, we recommend HDD’s free Serial Port Monitor.
To debug serial communications between Helm and a router or other device, follow these instructions.
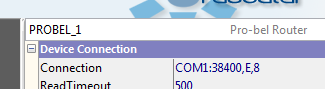
- Open your panel in Helm, and note which COM port is used for the device (COM1 in this example)
- Close Helm.
- Download and install HDD Serial Port Monitor.
- Start Free Serial Port Monitor.
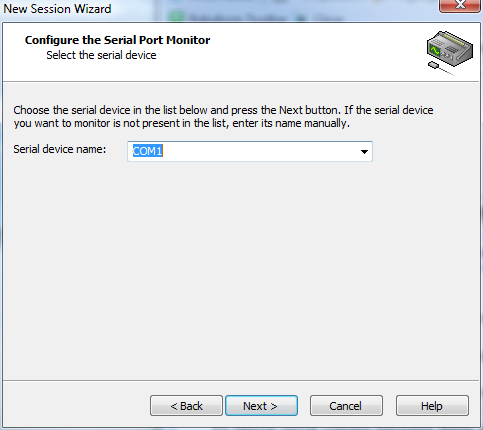
- Select File/New Session, session type Serial Port Monitor.

- Select the correct COM port.
- Select Request View visualizer.
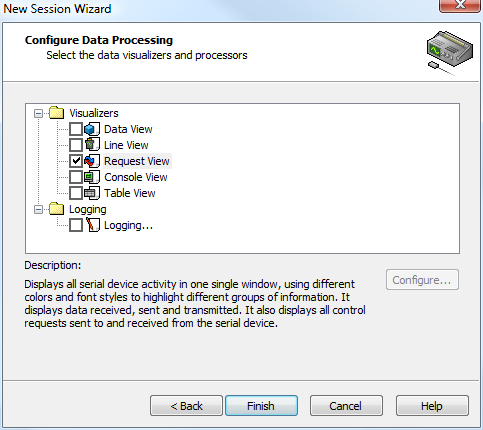
- Click Finish to start the monitor session.
- Now, start Helm Designer, and open your panel.
- Run your panel, and press buttons to cause messages to be sent to the device.
- The serial monitor should show the port being opened, and all data sent to and from the device.

- Use the Edit/Export menu to save the serial log to a file.
- Finally, please email the file to us for inspection!


As always, please remember to include the three key bits of information for fault finding and bug reporting:
- 1: What steps you did, *exactly*: Example
- I opened the attached panel in Helm Designer,
- I clicked the “Run Panel” button
- I pressed PGM bus “SERV A SRC” button
- 2: What you expected to happen: Example
- I expected PGM bus “SERV A SRC” button to switch on, and PST bus to remain unchanged
- 3: What actually happened… Example:
- PGM bus “SERV A SRC” button did switch on, but PST “SERV A SRC” also switched on!